Forex trading is a dynamic and fast-paced financial market where currencies are traded against one another. Traders use various strategies and tools to analyse the market and make informed trading decisions. One of the most widely used methods is price action analysis, which involves studying candlestick patterns and market dynamics. In this article, we will explore the concept of price action and how candlestick patterns can provide valuable insights into market trends and potential trading opportunities.
Understanding Price Action
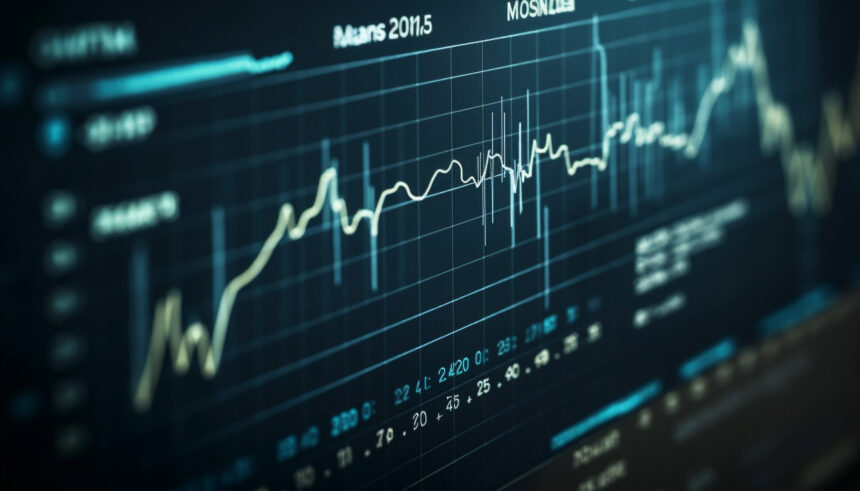
Price action refers to the movement of a financial instrument’s price over time. It is based on the belief that all relevant market information is reflected in the price itself. By analysing price action, traders aim to gain insights into the market sentiment and make predictions about future price movements.
Price action analysis focuses on patterns and formations that occur on price charts, without relying heavily on indicators or other technical tools. The primary tool used in price action analysis is the candlestick chart, which provides a visual representation of price movements within a specific time period.
Candlestick Patterns
Candlestick patterns are formed by a series of individual candles on a price chart. Each candle represents a specific time period, such as a minute, an hour, a day, or a week. Candlesticks are composed of four main components: the opening price, the closing price, the high price, and the low price.
Candlestick patterns are categorized into bullish and bearish patterns, depending on the direction of price movement. Bullish patterns indicate potential buying opportunities, while bearish patterns suggest potential selling opportunities. Here are a few commonly observed candlestick patterns:
- Doji: A doji occurs when the opening and closing prices are very close or equal. It indicates market indecision and often signals a potential trend reversal.
- Hammer and Hanging Man: These patterns have a small body and a long lower shadow, with little or no upper shadow. A hammer appears at the bottom of a downtrend, suggesting a potential bullish reversal. A hanging man occurs at the top of an uptrend, signaling a potential bearish reversal.
- Engulfing Patterns: Engulfing patterns occur when a larger candle fully engulfs the previous candle. A bullish engulfing pattern forms when a larger bullish candle follows a smaller bearish candle, indicating a potential bullish reversal. A bearish engulfing pattern suggests a potential bearish reversal.
- Morning Star and Evening Star: These patterns consist of three candles. The morning star is a bullish reversal pattern that appears after a downtrend. It begins with a long bearish candle, followed by a small body that gaps down, and ends with a long bullish candle. The evening star is the bearish counterpart of the morning star and indicates a potential trend reversal.
Market Dynamics
In addition to candlestick patterns, understanding market dynamics is crucial for successful forex trading. Market dynamics refer to the factors that influence price movements, such as supply and demand, economic indicators, geopolitical events, and market sentiment.
Price action analysis can help traders interpret market dynamics by identifying support and resistance levels, trend lines, and chart patterns. Support levels are price levels where buying pressure is expected to outweigh selling pressure, potentially leading to price bounces. Resistance levels, on the other hand, are price levels where selling pressure is expected to outweigh buying pressure, potentially leading to price reversals.
Trend lines are drawn on price charts to identify the direction of the market. An uptrend is characterized by a series of higher highs and higher lows, while a downtrend consists of lower highs and lower lows. By understanding the prevailing trend, traders can align their trading strategies accordingly.
Chart patterns, such as triangles, rectangles, and head and shoulders patterns, provide additional insights into market dynamics. These patterns are formed by the price movements on the chart and can indicate potential breakouts or reversals.
Conclusion
Forex trading requires a comprehensive understanding of market dynamics and price action analysis. By studying candlestick patterns and market dynamics, traders can gain valuable insights into the market sentiment, potential reversals, and trend continuations. However, it’s essential to combine price action analysis with other technical and fundamental analysis tools to make well-informed trading decisions. Developing a solid understanding of price action and continuously refining trading skills can significantly enhance a trader’s success in the dynamic world of forex trading.